Turning Multi-Cloud & SaaS Complexity into Control
Client Profile & Environment Snapshot
The Challenge: Sprawl Across 6 Clouds and 45+ SaaS Vendors
A global enterprise in the health & nutrition sector had grown into an extraordinarily complex cloud estate. Operations spanned six public clouds — AWS, Azure, GCP, Oracle Cloud Infrastructure (OCI), Azure China (operated by 21Vianet), and Alibaba Cloud — alongside more than 45 SaaS platforms. Engineering and business units operated across the Americas, EMEA, and APAC, including markets like mainland China where data-protection boundaries and sovereignty laws are notoriously stringent.
Each provider reported spend in its own siloed language, currency, and taxonomy. AWS Cost Explorer, Azure Cost Management, and Google Cloud Billing each offered fragmented viewpoints with no normalized definitions. Leadership was left without a single, trustworthy view of where the $80M annual technology budget ($30M cloud + $50M SaaS) was going.
The organization needed a Single Pane of Glass (SPoG) — a simplified, universal billing taxonomy across every cloud and SaaS subscription, coupled with intelligent recommendations that went far beyond the generic suggestions offered by individual cloud service providers. Their conviction was straightforward: with complete financial clarity in one place, they could finally take decisive control of total spend.
The Finomics Solution: Rapid Multi-Cloud & SaaS Convergence
Finomics integrated all 6 cloud environments — including European and China Sovereign regions — within the first 3 months of onboarding, and connected 36+ SaaS platforms within 4 months. The result was an enterprise-wide Single Pane of Glass delivering governance, control, and visibility down to the organization, account, category, service, resource, and SKU levels.
Unified Cloud View & Executive KPIs
Finomics starts with high-level KPIs where C-level executives gain comprehensive insights at the organization level. Views that previously required weeks of manual data aggregation and custom scripts now arrive in seconds, refreshed every day they log in. Cloud cost insights provide multi-dimensional views across Organization, Account, Category, Service, and Resource — down to granular SKU metrics.
The platform provides seamless day-over-day, month-over-month, and year-over-year comparisons, enabling leaders to immediately pinpoint trends, isolate which resources are driving cost growth, and focus on the highest-impact big-ticket items. Role-based access control (RBAC) ensures team leads and engineers only see the spend data relevant to their scope.
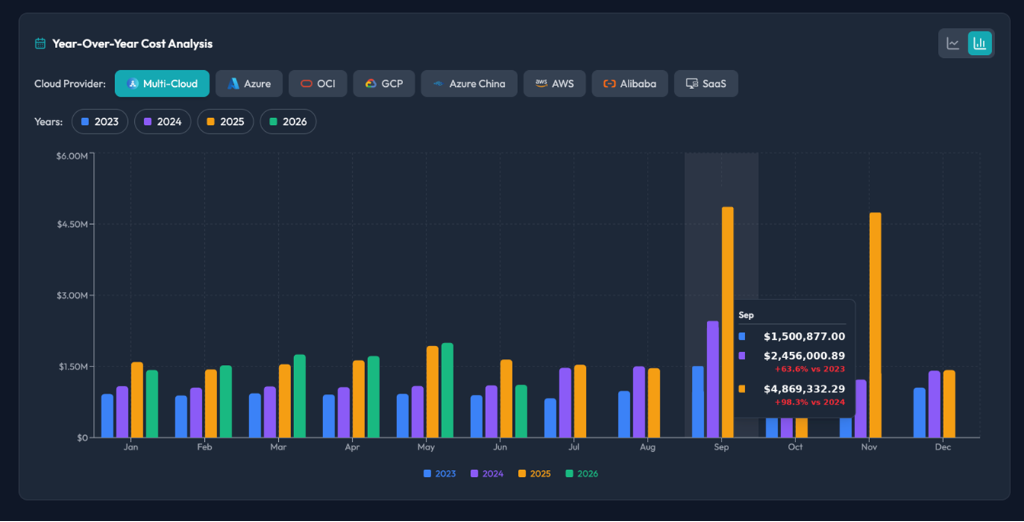
Figure 1: Finomics Year-Over-Year Cost Analysis dashboard displaying multi-cloud comparative spend tracking across AWS, Azure, OCI, GCP, Azure China, Alibaba, and SaaS.
Visual Cost Map & Data-Transfer Traceability
Traditional cloud provider dashboards hide or bury data transfer and egress costs. Finomics delivered a global visual cost map that traces inter-region, intra-region, and egress cost distribution directly down to the specific resource. Regional cost breakdowns reveal every service contributing to spend in each geography, ensuring international compliance and latency-optimized spend routing.
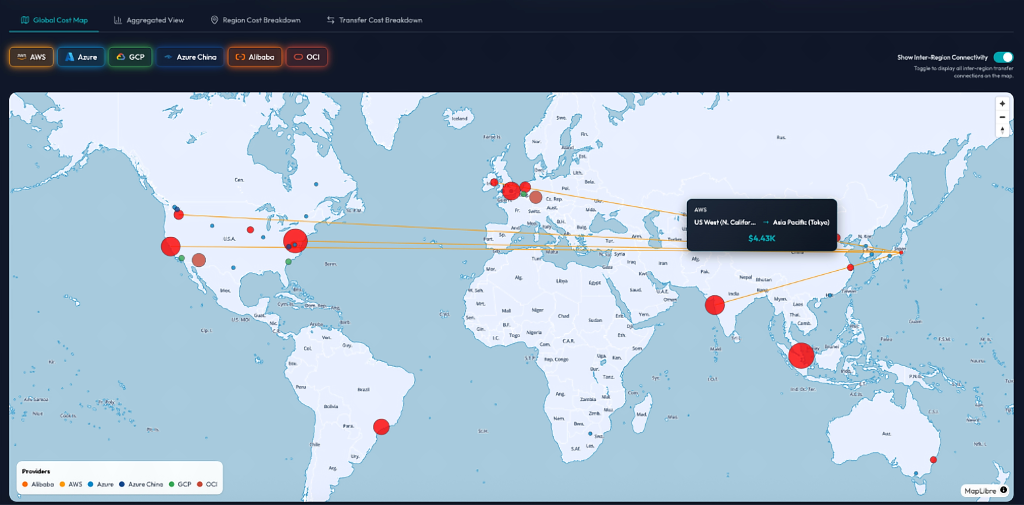
Figure 2: Finomics Global Cost Map showcasing worldwide deployment distribution and live inter-region egress transfer cost tracing.
Budgeting & AI-Powered Forecasting
Beyond standard quarterly and annual budgets, the Finomics AI forecasting engine modeled full-year spend while actively accounting for seasonality and promotional spikes. Capabilities delivered to the team included:
- Custom 'what-if' scenario modeling to pressure-test future architectural shifts and migrations before committing capital.
- Total cloud spend vs. budget tracking for continuous monthly utilization and burn planning.
- Granular team- and resource-level budgets, enabled by a standardized tagging taxonomy co-designed with Finomics.
Cost & Usage Recommendations: $500K+ Uncovered in 90 Days
Finomics' intelligent savings engine surfaced idle, underutilized, and over-provisioned resources — including optimization of workloads that cloud service providers had falsely marked as 'fully optimized' under existing savings plans.
Within the first 3 months, Finomics identified over $500,000 in annual recurring savings across Azure and AWS alone — immediately exceeding the cost of the platform itself. Crucially, the platform raised FinOps awareness across development teams, instilling sustainable resource utilization habits into sprint planning.
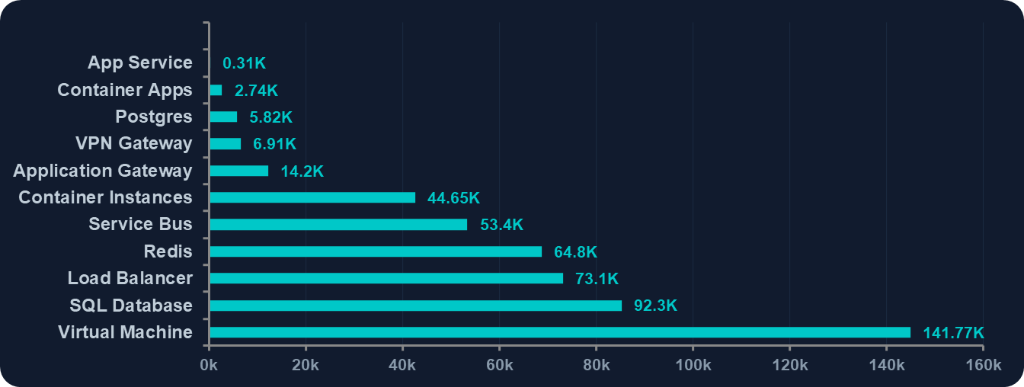
Figure 3: Service-level cost breakdown highlighting top cloud spend categories across Virtual Machines, SQL Databases, Load Balancers, Redis, and Service Bus.
AI Anomaly Detection, ITSM & Audit Log Integrations
An AI-driven anomaly detection engine continuously scanned both cloud and SaaS environments, catching thousands of subtle usage spikes before they could compound into seven-figure surprises. Key operational capabilities included:
- Service- and resource-level anomaly detection spanning multi-cloud compute, storage, and dynamic SaaS usage patterns.
- Direct alerting routed into Slack and Microsoft Teams for immediate operational response by engineering owners.
- Two-way ITSM integration: Engineers generate ServiceNow/Jira tickets directly from Finomics recommendations, mapped to the correct team, project, and owner.
- Full audit-log tracking showing exactly which teams reviewed recommendations and verified realized savings.
SaaS Integrations & Contract Entitlement Governance
Managing SaaS across 45+ platforms had previously been an opaque administrative chore. Finomics connected 36+ platforms in 4 months, transforming procurement from a reactive invoice-payer into a data-driven negotiator.
License Hygiene & Surfacing Hidden Charges
Finomics exposed total, assigned, unassigned, and dormant licenses across all connected tools — along with hidden storage fees and AI add-ons. Procurement discovered unexpected cost drivers they had never seen on standard invoices, including Microsoft 365 SharePoint storage overages, unassigned Copilot licenses, and usage exclusions across Google Apigee and Adobe.
Contract Entitlements & Renewal Leverage
Major SaaS providers like Apigee, Adobe, Salesforce, and Commercetools were previously costing millions with persistent risks of entitlement breaches. Finomics mapped active contracts and entitlements directly to live API and seat consumption, establishing automated warning thresholds to prevent penalty charges.
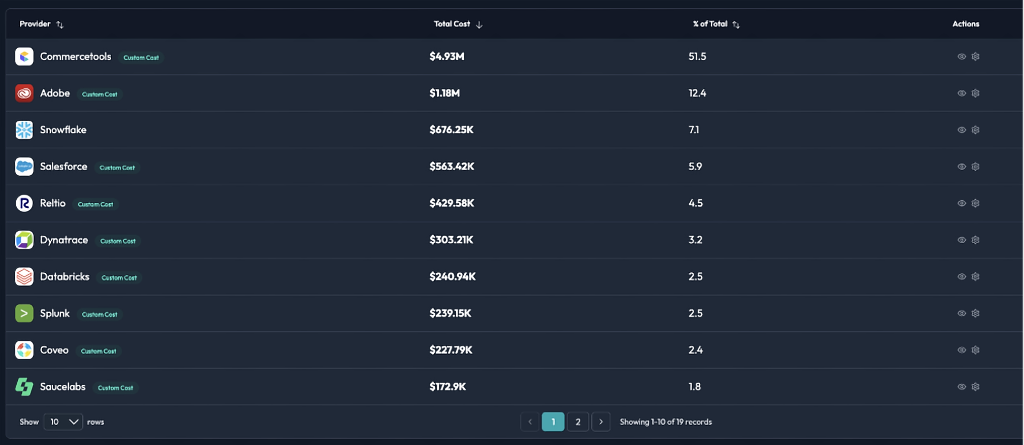
Figure 4: SaaS provider spend distribution and contract entitlement tracking across enterprise platforms including Commercetools, Adobe, Snowflake, and Salesforce.
Tokenomics: AI Cost & Token Governance
As generative AI initiatives accelerated, Finomics gave the client end-to-end visibility into AI spend and usage across Azure OpenAI and GCP Vertex AI. Engineering and finance teams gained token-level usage metrics, cost-per-token tracking, and token-to-business-outcome attribution — ensuring AI scaling remained financially predictable.
Results & Strategic ROI
The investment in Finomics paid off immediately. Within the first 90 days, Finomics surfaced $500K+ in annual cloud savings, fully covering the cost of the platform in under 4 months. On the SaaS side, procurement gained negotiating leverage that positioned the enterprise to save millions in upcoming contract renewals.
More importantly, Finomics transformed the organization's operating model around two core pillars:
- Shift-Left (Operational Proactivity): Developers and platform engineers now see the cost impact of their architecture choices before deploying to production.
- Shift-Up (Strategic Executive Alignment): The CIO, Director of FinOps, and CFO share a unified, validated single source of truth that translates raw cloud telemetry into business ROI.
“The tool paid for itself in the first three months. Finomics orchestrated a mission change for our FinOps approach: Shift-left operational proactivity and Shift-up strategic executive alignment.”