

Take Control of Your Evolving Microsoft 365 Costs
Intelligent FinOps Platform • Newsletter • Azure Edition
Your Microsoft 365 Intelligence Briefing
Microsoft 365 ecosystem is evolving—Teams for collaboration, SharePoint for content management, OneDrive for personal storage, and now Copilot bringing AI-powered intelligence directly into every workflow.
That evolution is exciting, but it comes with a hidden challenge: your costs are evolving too, and they’re doing it silently.
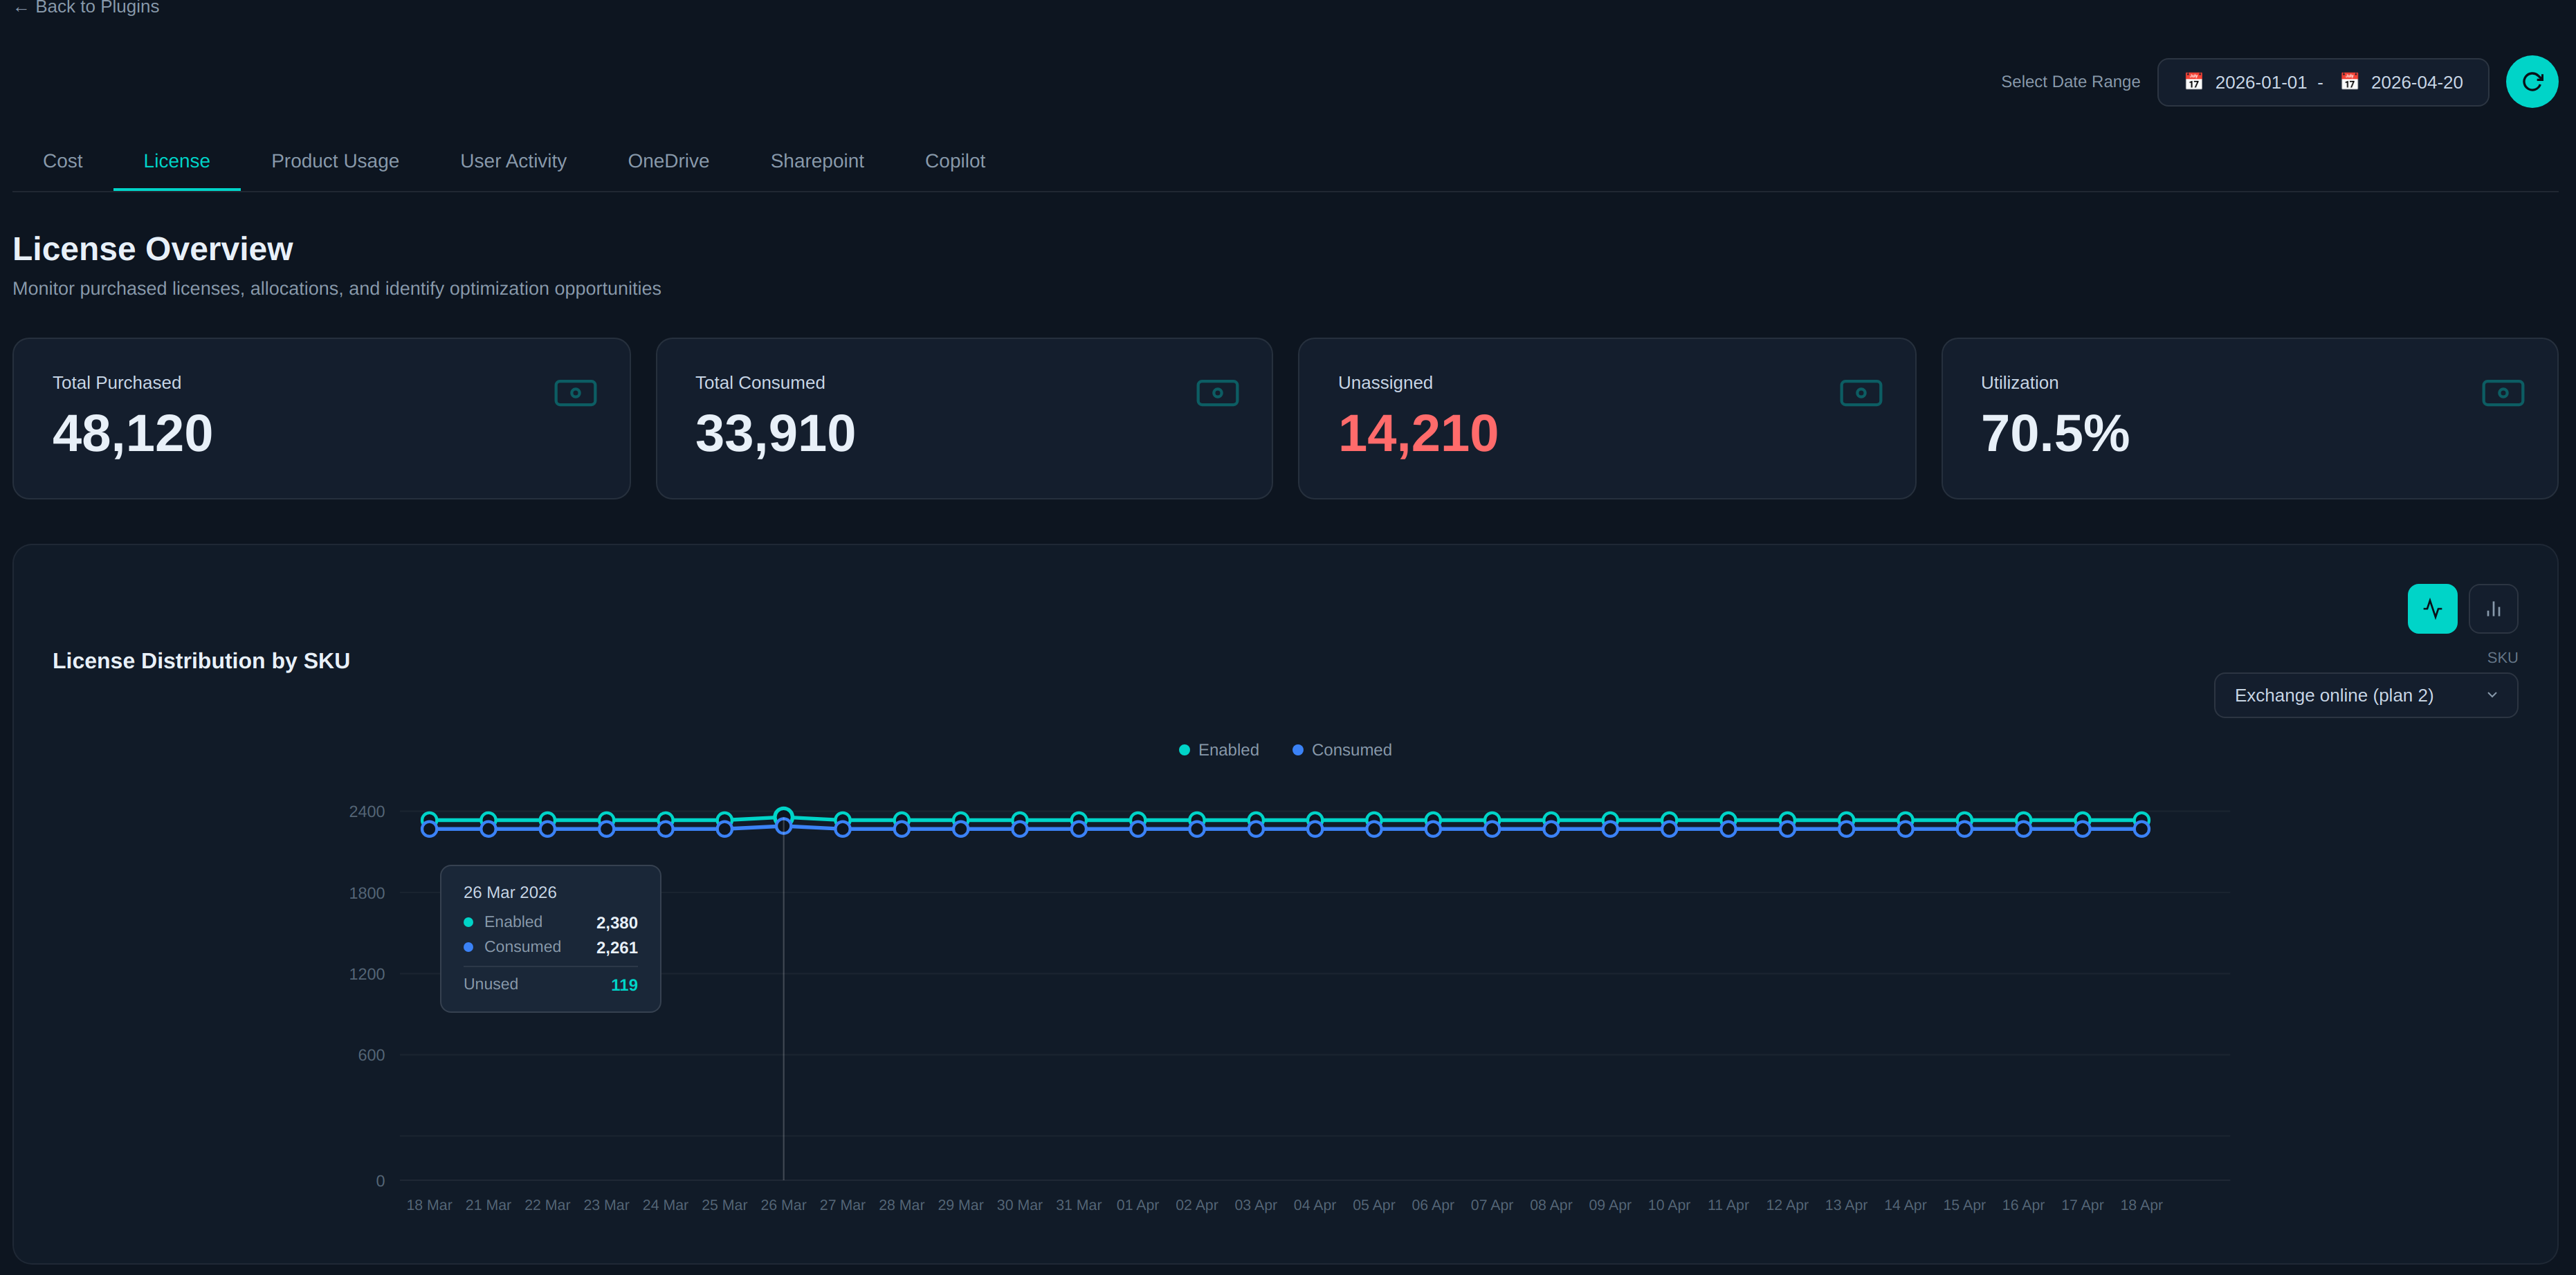
Here’s the reality: most organizations know how many licenses they’ve purchased, but far fewer can confidently say how many of those licenses are still justified by real usage. Employees leave, roles change, teams reorganize, contractors roll off—but the licenses assigned to those users often stay right where they are.
With Copilot now entering the picture at premium price points, this blind spot gets more expensive by the month. While an unused E5 license is costly enough, an unused Copilot seat at $30/user/month elevates the conversation entirely.
Key Takeaways
- Your M365 environment is growing in three dimensions at once: licenses, storage, and AI seats. Without connected visibility across all three, waste compounds quietly—and your renewal negotiations start from a position of guesswork instead of evidence.
This is where Finomics changes the game. Instead of treating Microsoft 365 as a flat SaaS bill, we help you see your environment through the lens of utilization, accountability, and optimization—connecting user activity, license allocation, storage consumption, and AI adoption patterns into a single decision-making layer.
FEATURE SPOTLIGHT
SharePoint & OneDrive: From Storage Black Hole to Governed Asset
The “Before”: What Most Organizations Are Living With
- SharePoint sites are created routinely—for projects, departments, initiatives, events—and most are never formally retired.
- Files accumulate in spaces nobody visits. Storage grows, allocations remain, and nobody has a clear view of what’s active versus what’s just taking up space.
- When it’s time for true-ups or renewals, the conversation defaults to the existing footprint because there’s no practical way to challenge it.
The result? You’re paying for storage that nobody uses, and you don’t even know how much.
The “After”: What Changes with Finomics
Our SharePoint Storage Analytics give you a complete breakdown of consumption across every site in your tenant. You can instantly see total sites tracked, storage consumed versus allocated, and—crucially—the ratio of active files to total files.
In one customer environment, only 124,518 out of 42 million files were actively in use, across 98.42 TB of consumed storage against a 5.20 PB allocation. That single data point tells an entire governance story.
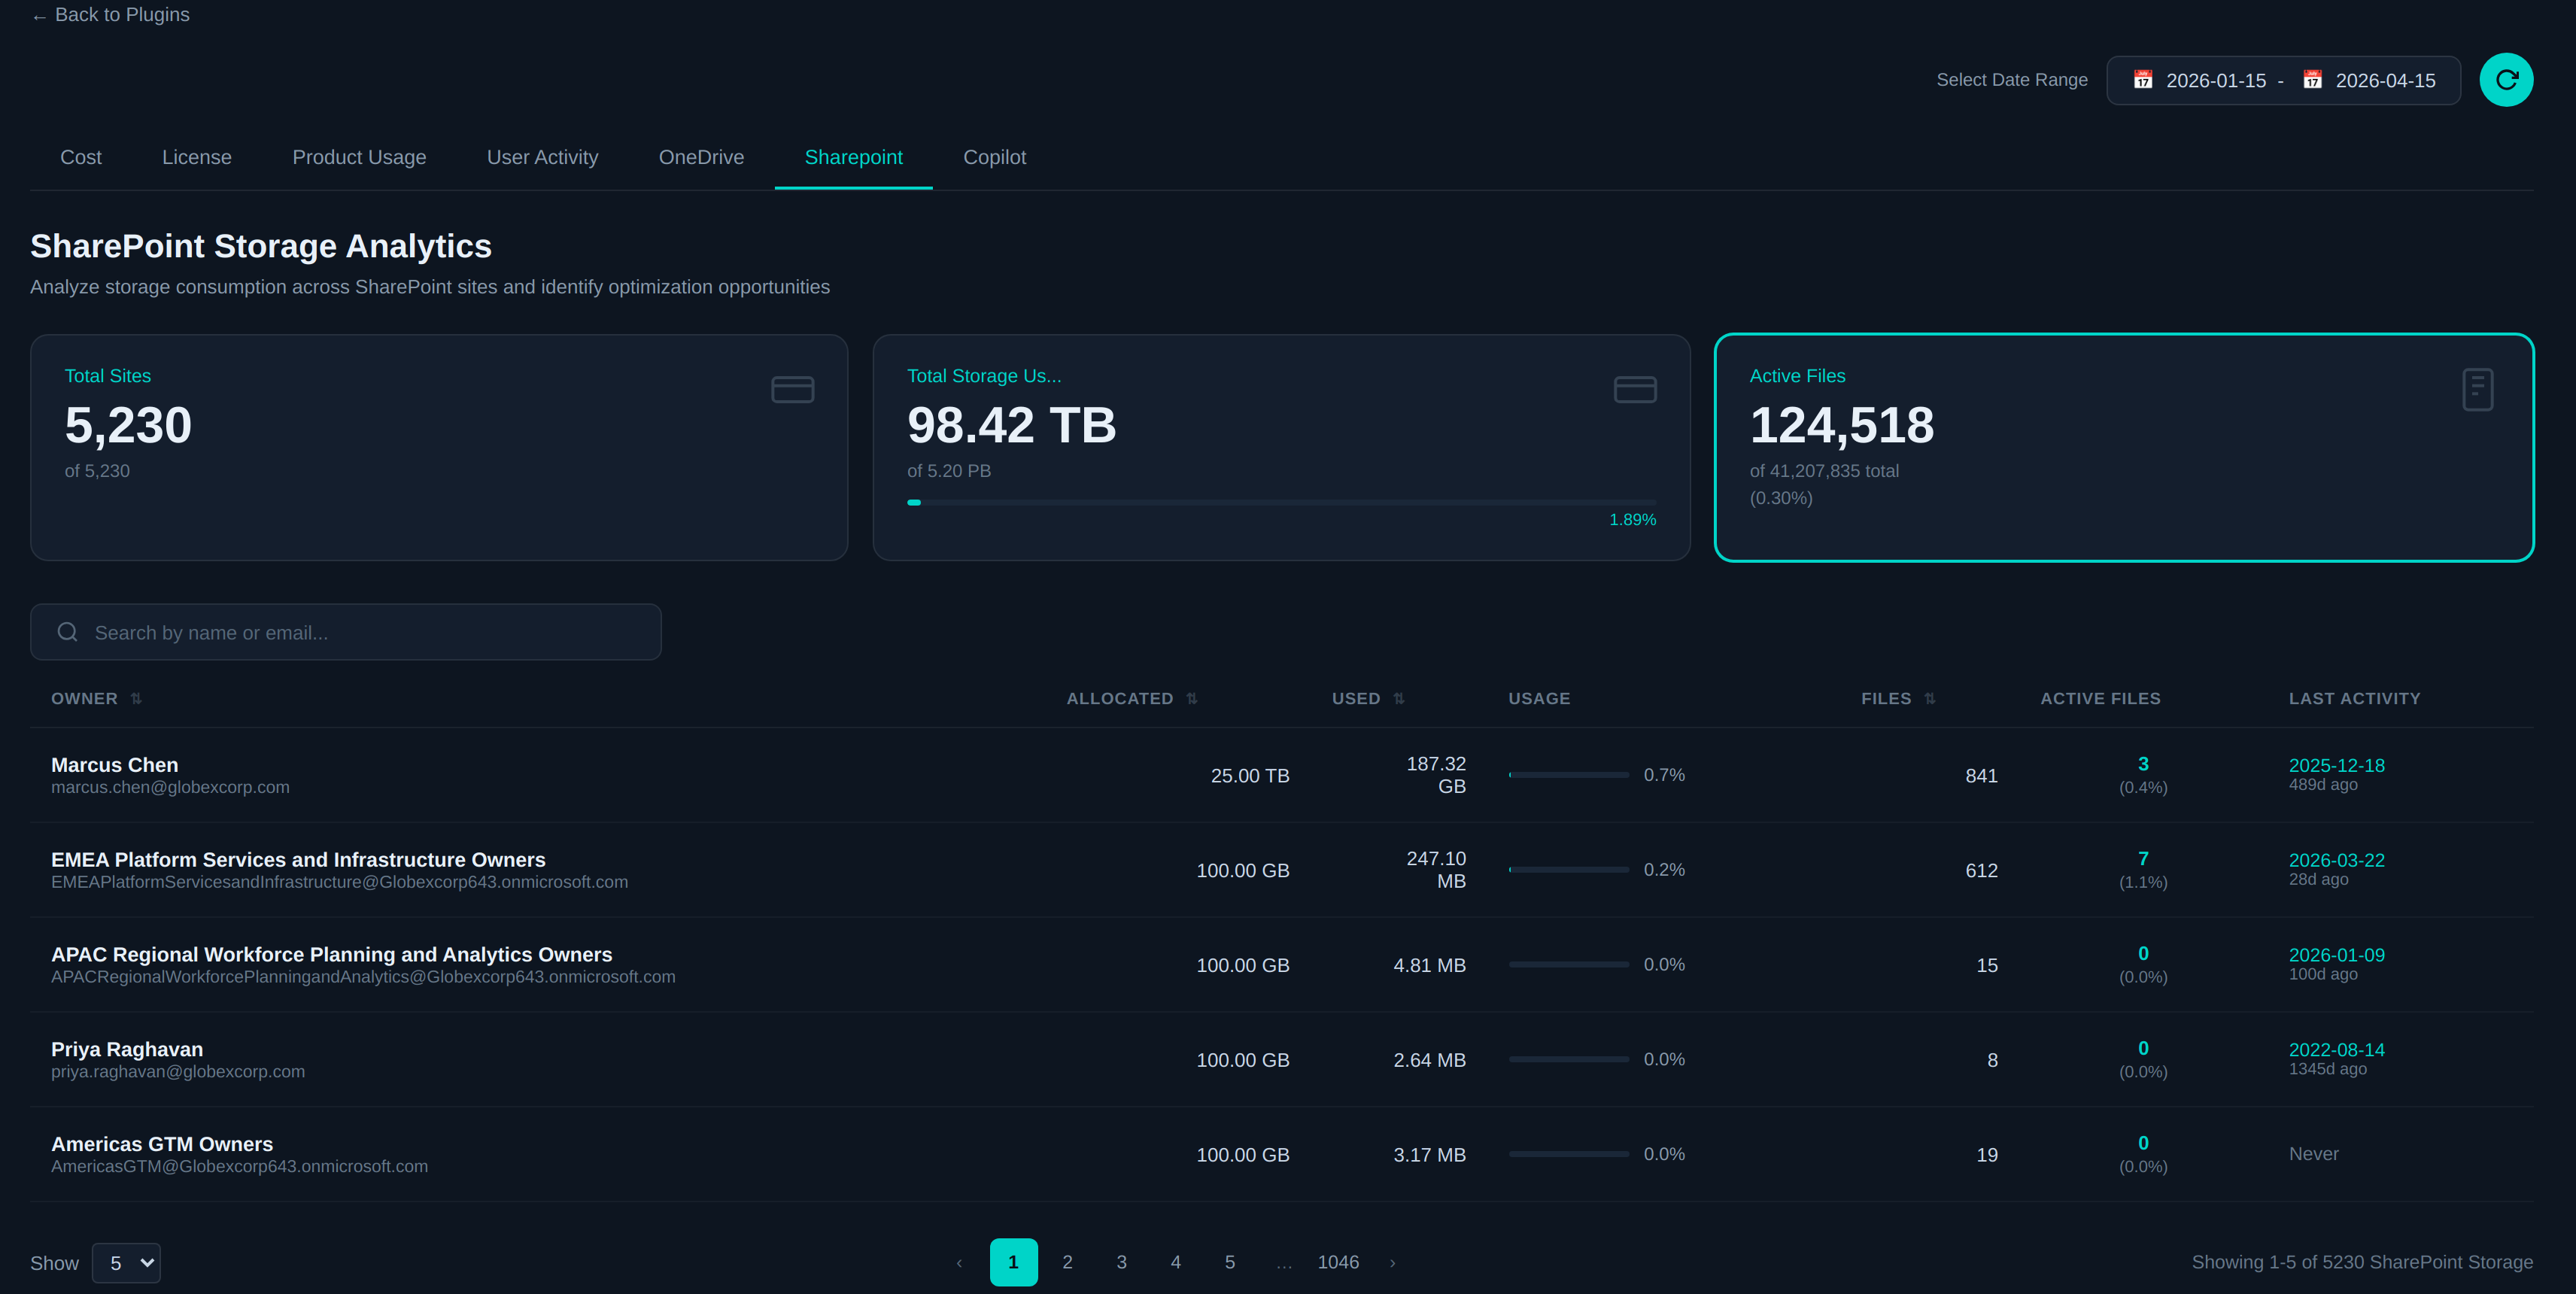
Each site is listed with its owner, allocated capacity, actual usage, file count, active file count, and last activity date. You can now prioritize cleanup based on clear signals: low usage ratios, zero active files, and stale timestamps.
Pro Tip: Quick Storage Win
- Start by filtering your SharePoint sites by “last activity date” and sorting oldest-first. Sites with no activity in 12+ months and fewer than 1% active files are your best candidates for archival or decommissioning. This single action can defer or eliminate your next storage tier upgrade.
THE INTELLIGENCE CORNER
Copilot: Are You Paying for Potential—or Performance?
Microsoft Copilot is among the highest-value—and highest-cost—additions to the M365 ecosystem. You’re assigning licenses with the expectation of transformative productivity gains. But here’s the question most organizations can’t answer with confidence:
Who is actually using Copilot, and across which products?
Without granular visibility, that investment quietly becomes one of the most expensive line items with the least accountability.
What Finomics Shows You
Our dedicated Copilot Usage Analytics track adoption at both the aggregate and individual user level:
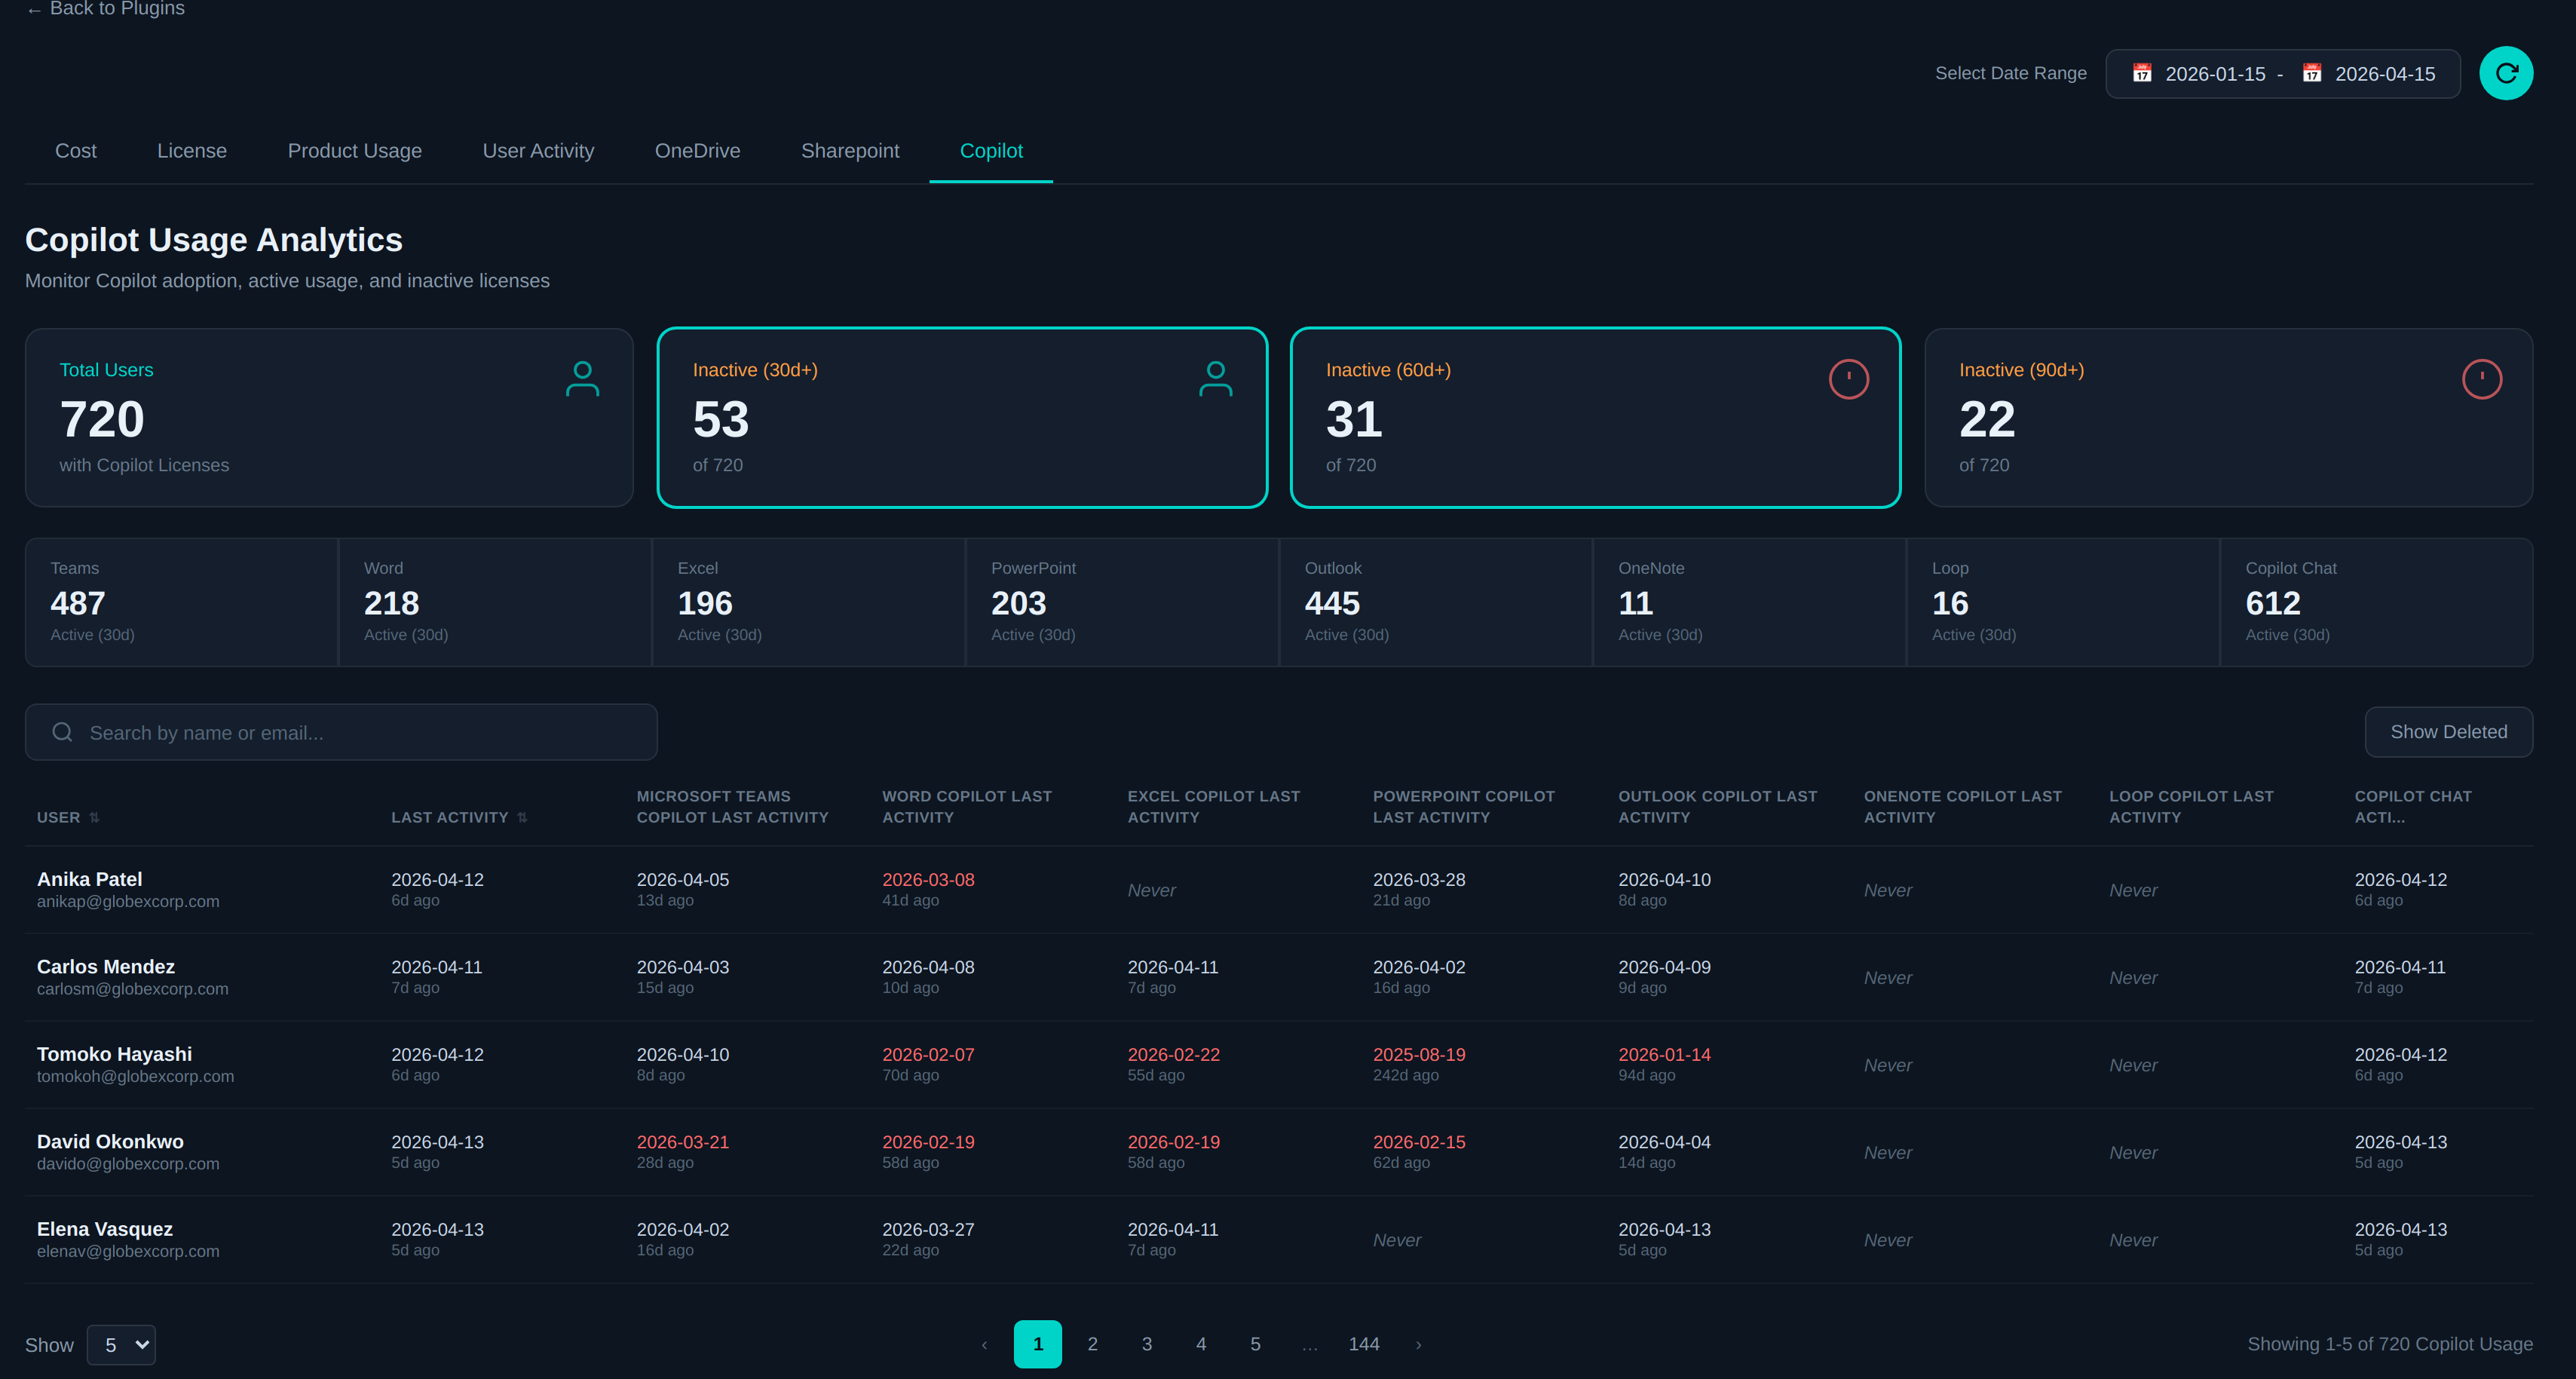
- Inactivity Flagging: See which licensed users have been inactive for 30, 60, or 90+ days. Red-highlighted dates make it immediately clear who hasn’t engaged with Copilot in weeks or months.
- Product-Level Breakdown: See active usage across Teams, Word, Excel, PowerPoint, Outlook, OneNote, Loop, and Copilot Chat. Know exactly where AI adoption is taking hold—and where it isn’t.
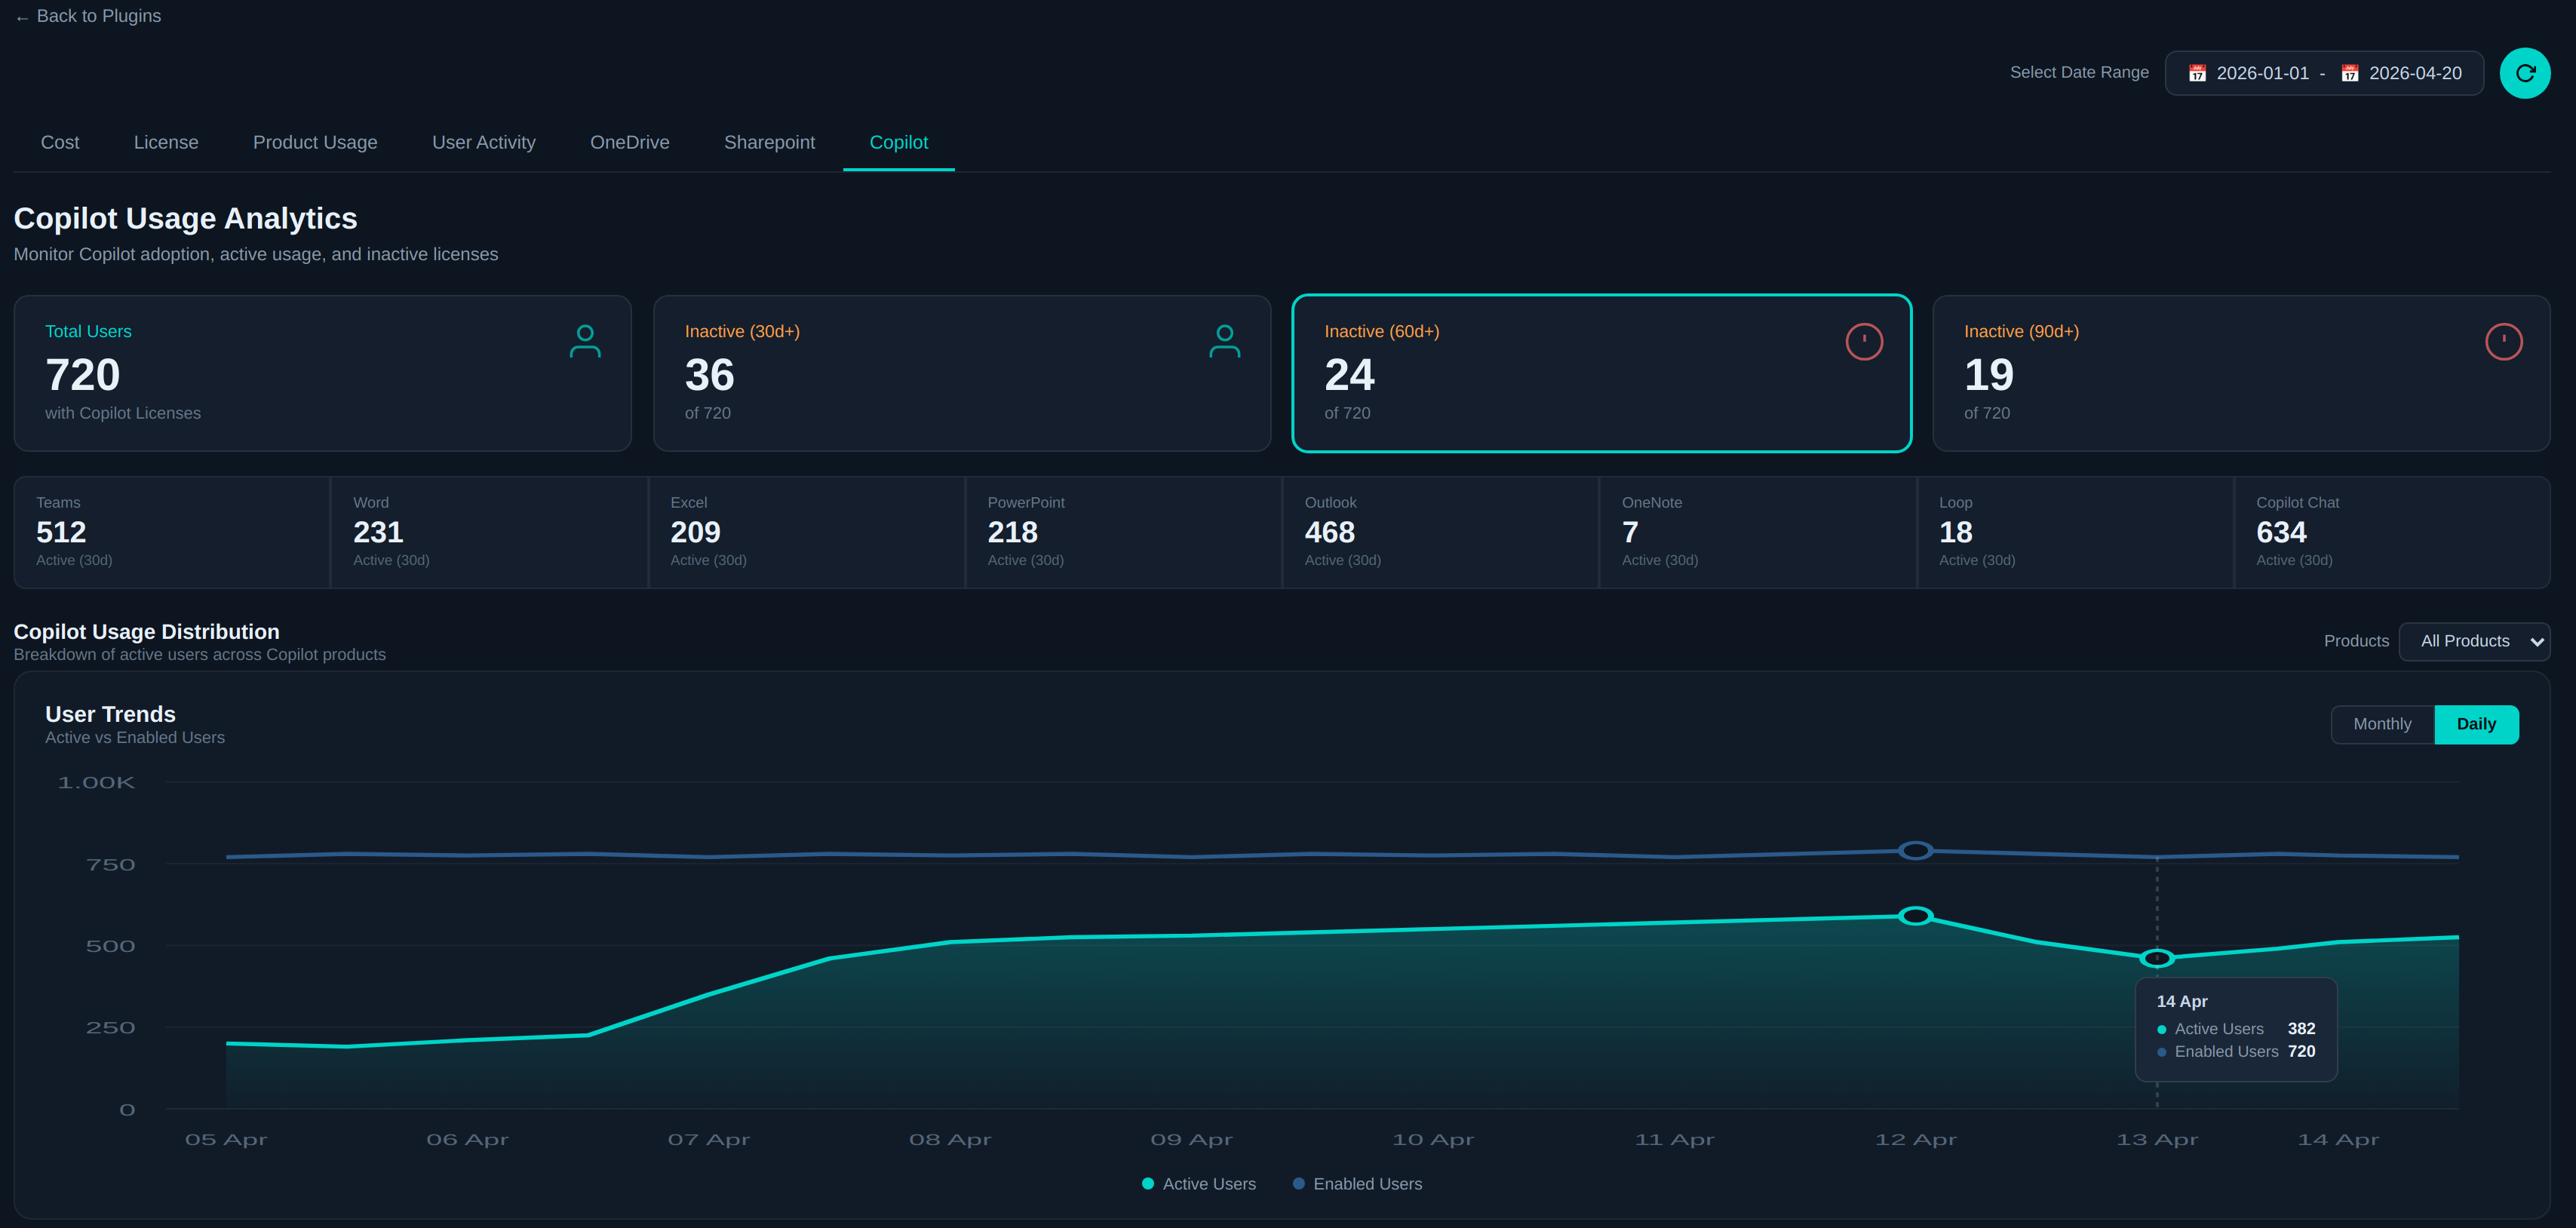
- Trend Analysis: Track active vs. enabled users over time. A widening gap between enabled and active users isn’t just an adoption metric—it’s a cost signal.
Real Numbers, Real Decisions
- If 720 users hold Copilot licenses but only 382 were active on a given day, that’s a meaningful portion of premium spend that may not be delivering return. Instead of debating whether Copilot is “worth it,” you can point to specific usage patterns and act: reallocate underused licenses, target training at low-adoption groups, or restructure assignments ahead of renewal.
YOUR ROI PLAYBOOK
Where the Hidden Savings Live in Your Tenant
We hear this question constantly: “Where do we start?” The answer is simpler than you think. Your M365 tenant has three reliable pockets of hidden savings—and Finomics helps you find all of them.
| Optimization Area | What to Look For | Your Impact |
|---|---|---|
| Inactive License Reclamation | Users inactive 90+ days who still hold paid licenses. Includes deleted accounts, departed employees, and role changes. | Direct cost recovery for every license removed. In large tenants, even a small reclamation percentage yields five- to six-figure annual savings. |
| SharePoint Storage Cleanup | Sites with <1% active files and no recent activity. Storage allocated to projects, teams, and initiatives that have quietly ended. | Avoid costly storage tier upgrades. Reduce true-up exposure. Reclaim capacity without buying more. |
| Copilot License Right-Sizing | Licensed users with zero or minimal Copilot engagement across all products. Seats assigned on expectation but never activated. | Premium license costs avoided. Reallocation to higher-value users who will actually leverage AI. Cleaner ROI story for leadership. |
The Bottom Line
- In larger tenants, even reclaiming a small percentage of unused licenses or downgrading storage allocations can produce five- and six-figure annual savings. But the value goes beyond cost alone—it’s about building confidence that every dollar spent on M365 is backed by real demand.
Stronger Renewal Positioning
Perhaps the most underappreciated benefit is what this data does for your renewal conversations. When you walk into an Enterprise Agreement renewal with clear evidence of utilization by SKU, product adoption rates, storage consumption patterns, and Copilot ROI metrics, the negotiation changes fundamentally.
You’re no longer asking for a discount based on gut feel—you’re presenting evidence. And that evidence is consistent, credible, and current because it comes from the same platform you use for day-to-day governance.
PRO TIPS
Quick Wins You Can Act on This Week
-
Run a 90-Day Inactive User Report.
- Pull up your license analytics and filter for users who haven’t touched Exchange, Teams, SharePoint, or OneDrive in 90+ days. These are your first candidates for license reclamation or downgrade.
-
Sort SharePoint Sites by Last Activity.
- Filter oldest-first. Any site with no activity in 12+ months and fewer than 1% active files should go on your archival shortlist. You’ll be surprised how much storage you can reclaim.
-
Audit Your Copilot Assignments.
- Check the per-user Copilot breakdown. If someone hasn’t used Copilot in any product for 60+ days, consider reassigning their license to a team that’s actively requesting AI tools.
-
Build a Monthly Review Cadence.
- Set a recurring calendar event: inactive users monthly, storage sprawl quarterly, Copilot ROI at each renewal milestone. Governance isn’t a project — it’s a rhythm.
-
Share One Dashboard with Finance.
- The fastest way to build cross-functional alignment is to give your finance team access to the same utilization data you’re using. When IT and finance look at the same numbers, optimization becomes a shared goal instead of a turf battle.
WHAT’S NEXT
Ready to See What’s Hiding in Your Tenant?
Every month your M365 tenant runs without connected visibility, waste compounds. Licenses stay assigned to ghosts. Storage bloats unchecked. Copilot seats collect dust at premium prices.
It doesn’t have to be that way. Finomics gives you the clarity to break the cycle—lower waste, stronger governance, better renewal positioning, and a mature operating model that improves with every review cycle.
Get Started
- Reach out to your Finomics account team or visit finomics.ai to schedule a personalized walkthrough of your M365 environment. See your own data. Find your own savings. Make your next renewal your strongest one yet.
Finomics Team
FinOps Insights Team
Cloud cost optimization, SaaS spend intelligence, and FinOps product insights from the Finomics team.
Frequently Asked Questions
Everything you need to know about this topic.
Related Insights
Discover more cloud financial intelligence.